Welcome to the world of mobile gaming, a fast-growing industry that’s been thriving since 2007. Thanks to devices like smartphones and tablets, playing games has become super easy, no matter where you are.
Because of this, a lot of people love mobile games, and they’re worth more than $100 billion every year! Especially after the pandemic platform changes, things seem to be getting better in the mobile game industry.
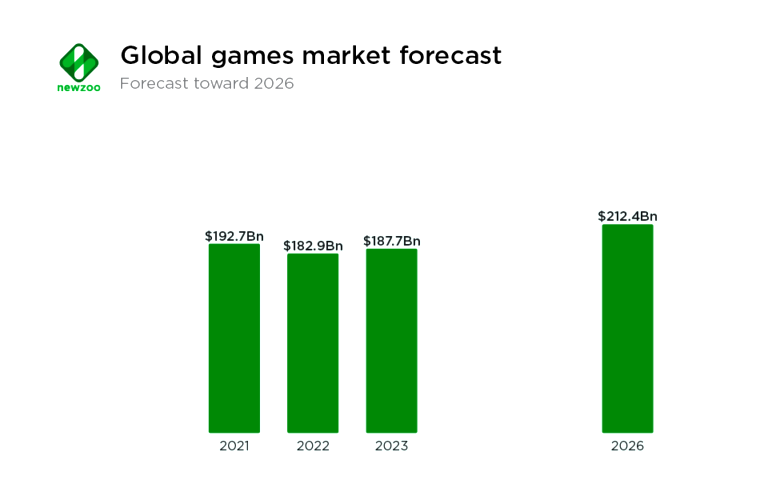
According to Newzoo, the worldwide games market is expected to bring in about $212.4 billion in earnings each year by 2026. Every part of the industry is set to grow, but each one might grow a bit differently.

In this article, we’ll explore various aspects of mobile gaming including size, share, trends, and forecast the future of mobile games.
We’ll discuss market share and factors contributing to its growth. We’ll also investigate popular classifications and genre games, analyzing their penetration, user retention, growth trends, and user behavior.
Additionally, we’ll examine retention rates and profit income in different game genres for 2023. To understand gamers better, we’ll investigate the average time people of different ages spend playing various game genres, making comparisons between females and males in terms of time spent in different categories.
Table of Contents
Why Focus on the Mobile Game Market?
Mobile game markets offer promising insights and opportunities within the gaming industry. While the industry may seem vast, this article can provide valuable insights that can help you find new opportunities.
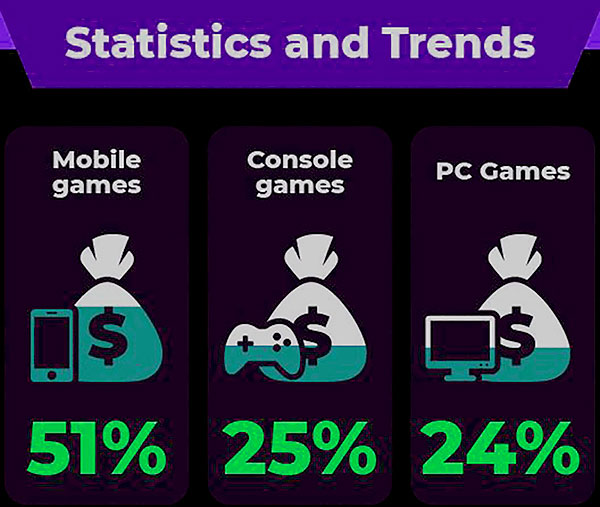
Once you pick a game type, you can research it to make your game unique. Mobile games make up 51% of global gaming revenue, followed by console games (25%) and PC games (24%). Approximately 62% of smartphone users install games within a week of getting their phones, and mobile games occupy more than 43% of smartphone usage time.

On the other hand, in the United States, 57% of people play games on their smartphones, 46% use gaming consoles, and 42% play games on their computers.
Therefore, there is no doubt that mobile games are becoming a profitable and flourishing business alternative over time. Mobile gaming applications are becoming increasingly popular throughout the world among people of all ages and genders.
The worldwide gaming market in 2023:
Mobile games make a lot of money, about $92.6 billion. However, their growth is slow, only 0.8% in 2023. Console games are doing great, growing by 7.4%, making $56.1 billion. PC games are steady at 1.6%, reaching $37.1 billion. But browser PC games are going down, dropping by 16.9% to $1.9 billion in 2023. Cloud gaming is getting popular, with an expected 43.1 million users in 2023 and a huge 80.4 million users by 2025.

Defining Mobile Game Genres
Defining mobile game genres is crucial for game designers, as it provides a fundamental understanding of various types of mobile games and contributes to the development of this market.
Here, there are some examples of subcategories:
| Game genre | Example games |
| Classical games | Chess, bridge, poker |
| Social network games | Farmville, Mafia wars |
| Casual games | Bejeweled, minesweeper |
| Web browser games | Travian, Pirate quest |
| Massive Multiplayer Online games | World of Warcraft, Lord of the Rings |
| Strategy games | StarCraft, DotA, Age of Empires |
| Point and Click and Puzzle games | Dragon Age, Final Fantasy |
| Role-playing games | Dragon Age, Final Fantasy |
| First-person shooter games | Need for Speed, Mario Cart, FIFA |
| Simulation games | Farming simulation, The sims |
| Learning games | Learn to drive, Brain trainer |
| Racing and sports games | Singstar, Guitar Hero |
| Adventure games | Assassins Creed, Tomb Raider, LEGO |
| Party games | Sing star, Guitar Hero |
| Other games | n/ a |
For more information, click the link to explore Mobile Game Genres.
Importance of Understanding Market Share
To run a successful business, understanding how your market operates is essential. By identifying your consumer’s true desires, you can enhance your offerings to fulfill their requirements.
The mobile gaming industry grew from $78.7 billion in 2019 to $96.8 billion in 2022, and it is projected to surpass desktop and console games in the next few years.
Key Tools for Analyzing Market Share
Various analytics platforms are available to help us analyze data, including AppMagic, Statista, Sensor Tower, Game Intel, Udonis, App Annie, Google Play Trends, and other applications.
These tools provide data and insights about mobile apps and their performance, allowing developers and marketers to track app performance on different app stores, analyze user engagement, and gain valuable insights into the mobile app market.

Popular Mobile Game Genres by Penetration
Analyzing genre data helps enhance your insights for developing your company. Below, you’ll find penetration rates among smartphone users.
| Mobile Gaming Genres | Penetration rate among smartphone users |
| Puzzle | 57.29% |
| Arcade | 55.6% |
| Action | 34.75% |
| Racing | 31.31% |
| Strategy | 15.79% |
| Adventure | 15.51% |
| Card | 15.44% |
| Board | 14.09% |
| Simulation | 13.72% |
| Word | 13.52% |
Comparison of IOS VS. Android
Explore the user retention rates for various mobile game sub-categories based on both IOS and Android platforms, revealing which games keep players engaged the longest. In addition, we can observe that IOS users have higher retention rates on this platform.
| iOS Game sub-category | User Retention %age | Android Game sub-category | User Retention %age |
| Puzzle | 5.4% | Adventure | 3.2% |
| Board | 5.2% | Puzzle | 3.1% |
| Educational | 5.1% | Role Playing | 3,1% |
| Action | 5% | Arcade | 3% |
| Arcade | 4.9% | Strategy | 3% |
Mobile Game Genre Growth Trends
Data presented in the following tables is based on Statista.
| Game genre | Growth from H1 2021 to H1 2022 | Growth from H1 2020 to H1 2021 |
| Hyper-casual | -2.2% | +41.3% |
| Lifestyle | -4.8% | +2.6% |
| Puzzle | -8.8% | +14.8% |
| Strategy | -9.2% | +23.4% |
| RPG | -10.4% | +6.6% |
| Action | -10.5% | +68.9% |
| Casino | -10.9% | +3.5% |
| Sports | -11.7% | +1.7% |
| Simulation | -14.9% | +10.7% |
| Shooter | -24.5% | +16.7% |
| Geolocation AR | -26% | -5.8% |
| Racing | -28.8% | -3.8% |
Retention Rates from 2023
In 2023, retention rates for mobile games experienced a slight decrease compared to the previous year. Specifically, on Day 1, the retention rate is 28%, marking a decline from the previous period.
As users progress, the rates continue to decrease, reaching 13% on Day 7, 9% on Day 14, and 6% on both Day 28 and Day 30. Notably, the Day 30 retention rate remains consistent with the figures from 2022, staying at 6%.
| Gaming app retention rates, Q1 2022 vs. Q1 2023 | ||
| Day after install | 2022 | 2023 |
| 1 | 29 % | 28 % |
| 3 | 19 % | 19 % |
| 7 | 14 % | 13 % |
| 14 | 10 % | 9 % |
| 28 | 7 % | 6 % |
| 30 | 6 % | 6 % |
Install Sources
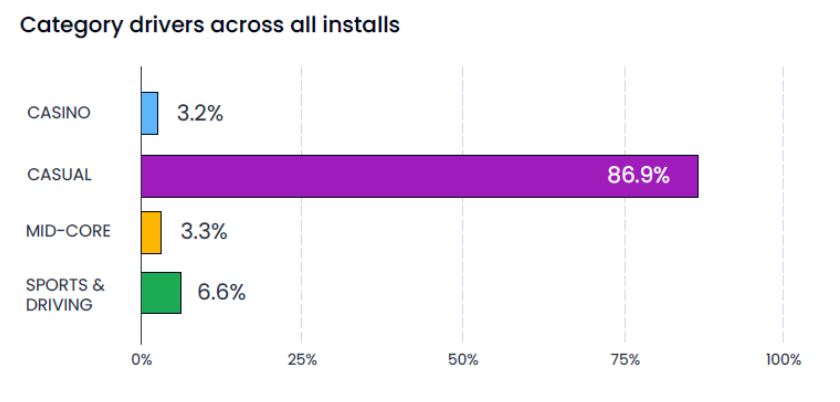
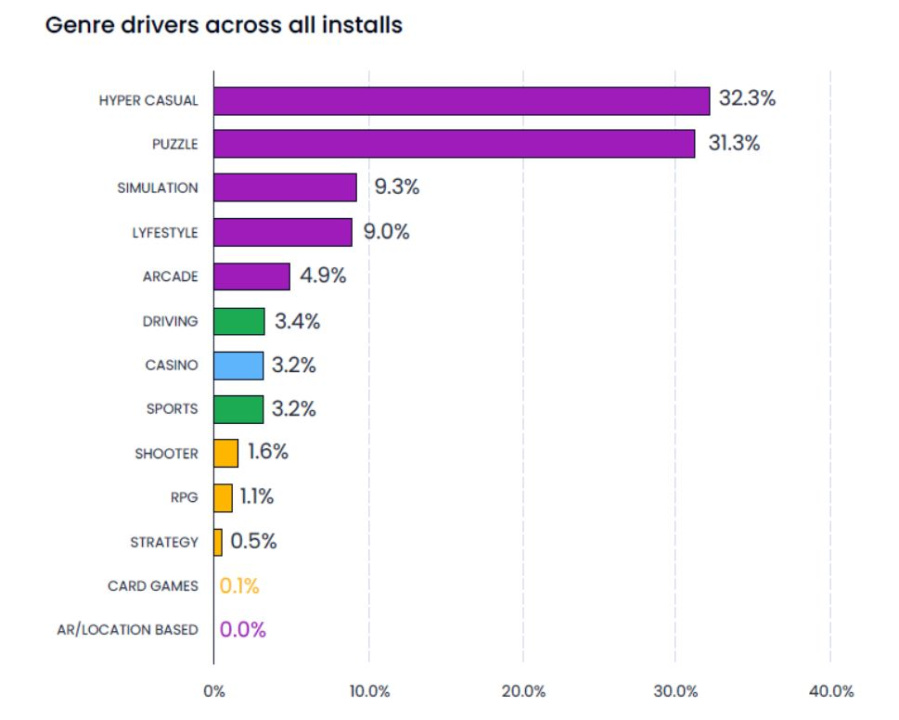
Casual games are where most people install games, making up a big 86.9%. Sports and driving games come second but are quite far behind at 6.6%.
Casual games attract installs for themselves and have a big impact on other categories. In fact, 74.7% of mid-core game installs come from ads in casual games.


Exploring Profit Income in Different Genres of Mobile Games
Discover the financial performance of different mobile game categories compared to previous years, offering valuable industry insights.
In 2022, RPGs emerged as the highest-earning genre, generating $25.5 billion, followed by strategy games at $12.1 billion.
Globally, it is anticipated that mobile gaming will generate $116.4 billion in revenue by 2024.
(Source: Earth Web)
| Mobile game genres | Revenue for 2022 | Revenue for 2020 | Revenue for 2019 |
| RPG | $25.5 billion | $21.9 billion | $18.3 billion |
| Strategy | $12.1 billion | $15.1 billion | $11.7 billion |
| Puzzle | $8.7 billion | $8.5 billion | $7 billion |
| Casino | $8.3 billion | $7.2 billion | $4.9 billion |
| Shooter | $4.8 billion | $5.7 billion | $3.8 billion |
| Simulation | $8.1 billion | $4.1 billion | $2.7 billion |
| Lifestyle | / | $3 billion | $2.2 billion |
| Sports | $2.8 billion | $2.9 billion | $2.1 billion |
| Action | $5.3 billion | $2.2 billion | $1.7 billion |
| Geolocation AR | / | $1.9 billion | $1.3 billion |
Revenue per active use by mobile game genre
The income generated by each player within different mobile game genres shows the varying financial efficiency of these gaming categories.
| Mobile Game Genre | Revenue per active user |
| Role Playing | $0.66 |
| Adventure | $0.50 |
| Strategy | $0.21 |
| Casino | $0.19 |
| Racing | $0.19 |
| Card | $0.18 |
| Action | $0.18 |
| Puzzle | $0.16 |
| Casual | $0.15 |
| Simulation | $0.14 |
How Long Do Mobile Gamers Play?
In this section, we’ll discuss the time spent playing various game categories and genres. Furthermore, we’ll compare the playtime of users across different sex.
Playtime Across Mobile Game Categories in Different Regions
This table provides information on the average time by mobile games in different classifications on various mobile game genres. African gamers show strong dedication, playing casual mobile games for an average of 26 minutes, showing their strong dedication. Here’s a breakdown of time spent in minutes on different genres worldwide.
| Genre | North America | Latin America | Europe | Africa | Asia-Pacific |
| Hyper-casual | 5.4 min | 5.8 min | 6.7 min | 6.6 min | 7.2 min |
| Casual | 15 min | 18.8 min | 23.7 min | 26 min | 21 min |
| Midcore | 15.4 min | 23.7 min | 18 min | 17.5 min | 16.4 min |
| Hardcore | 18.1 min | 26 min | 19.7 min | 13.8 min | 16.5 min |
| Social Casino | 11.4 min | 21 min | 19.9 min | 17.1 min | 21.4 min |
(adjoe)
Playtime Across Mobile Game sub- genres: per-user minute
In this part, we have a closer look at time Spent in Mobile Game Genres by Active Users (in minutes)
| Genre | minutes |
| Puzzle | 105 |
| Casual | 93 |
| Arcade | 73 |
| Simulation | 71 |
| Adventure | 71 |
| Strategy | 70 |
| Card | 69 |
| Board | 63 |
| Role Playing | 62 |
| Action | 59 |
Playtime on Game Classification by Age:
This table provides a comprehensive overview of how playtime is distributed among different age groups and game classifications, offering valuable insights into user behavior within the mobile gaming landscape.
To elucidate, A surprising number of users under 50 spend most of their time playing mobile games. Daily, they spend 7.7 minutes on average.
| Game genre | 0-19 years | 20-29 years | 30-39 years | 40-49 years | 50+ years |
| Hyper-casual | 4.9 min | 6.2 min | 6.2 min | 6.7 min | 7.7 min |
| Casual | 15.2 min | 20.3 min | 21.8 min | 22.5 min | 22.8 min |
| Midcore | 12.3 min | 14.8 min | 17.5 min | 18.1 min | 17.1 min |
| Hardcore | 15.9 min | 16.9 min | 17.5 min | 16.1 min | 14.1 min |
| Social Casino | 14.4 min | 13.9 min | 17.8 min | 18 min | 18.4 min |
(adjoe)
Comparison of playtime in different classifications:
This table is a comparative analysis of how women and men spend their time on mobile games across various mobile game genres. Obviously, women are often more dedicated mobile gamers than men. They play for longer times in most types of games.
| Game Genre | Females | Males |
| Hyper-casual | 6.4 min | 6.4 min |
| Casual | 22.8 min | 19 min |
| Midcore | 17.5 min | 15.1 min |
| Hardcore | 15.4 min | 17.4 min |
| Social Casino | 16.9 min | 16.2 min |
Conclusion
Consequently, this article includes some interesting facts about classifications, genres, and subgenres in mobile games across different regions. When a game performs well, it provides an opportunity to grow this industry with revenue. Various platforms are used to compare statistics and trends in different game genres, retention rates, and playtime in various game categories, as well as playtime per active user. Analyzing the time users spend playing mobile games can help us identify trends in these genres and classifications.
