Key Performance Indicators (KPIs) are crucial metrics that measure a business’s success in achieving its operational and strategic goals.
Whether assessing overall or specific business performance, KPIs provide essential insights for effective decision-making. Selecting relevant KPIs involves understanding your goals and integrating tracking into development and promotion plans.
KPIs help managers gauge the effectiveness of their functions, processes, campaigns, and actions. Keep an eye on your most important KPIs all in one spot, get a complete view of your business, and make smarter decisions.
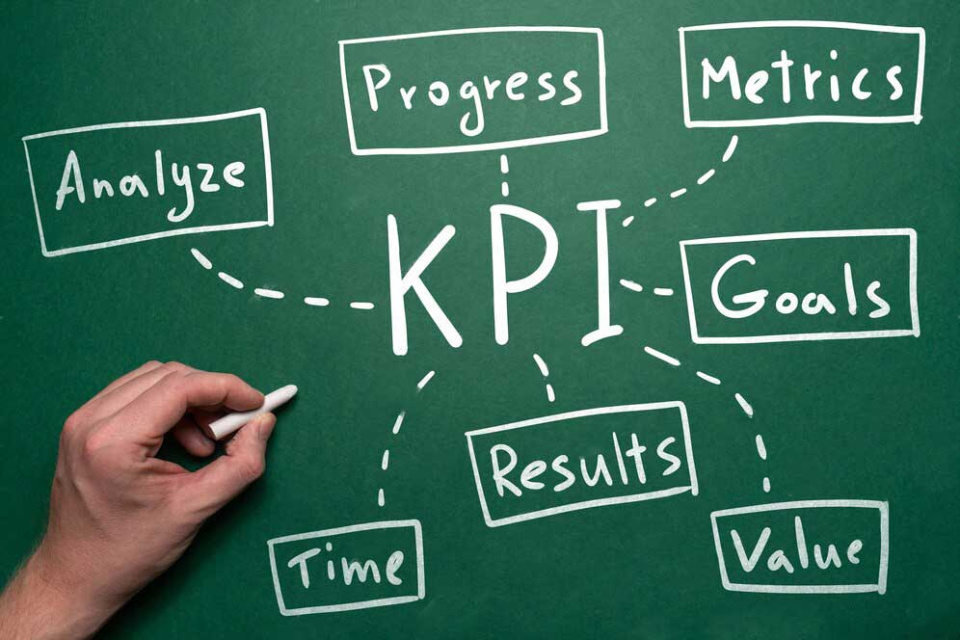
In this article, we have gathered more than 40 essential KPIs in specific categories But don’t panic: you don’t need to know all of them, all of the time. Additionally, we will explain what KPI terms mean, why they matter, and how to use them well.
You’ll discover how to elicit, apply, and balance KPIs to boost your results and achievements by using the KPIs pyramid. Subsequently, it will help determine which KPIs are relevant. Which ones will assist you, and which ones might be distracting?
The right ones for you will depend on your game and your objectives.
Table of Contents
How to Choose the Right KPIs for Your Business:
Choosing the right KPI in developing your industry can make a great contribution. To elucidate, in the industry of mobile game the right ones for you will depend on your game and your objectives.
More numbers don’t always mean a better understanding of what your company needs. To determine the most valuable key performance indicator (KPIs) for a new business, we advise 12 tips for choosing effective KPIs. Considering these points can help us in choosing the right KPI.
Stay on track with your strategy
Identify your business goals, your industry, and your objects. Your KPIs should show what’s most important for your success and how you’re going to make it happen.
To pick the right KPIs for your mobile game, start by figuring out what you want to achieve. For instance, if you want to get a bigger piece of the market, you might look at KPIs like how much money you make, getting new customers, and keeping the ones you have.
If you’re trying to spend less money, you might focus on KPIs like how much you make after costs, how much you spend, and how much you gain from what you put in. Knowing your goals helps you choose the best KPIs to understand and improve your game.
Consider the target audience and Customer’s Perspective:
Measure the customer experience. Understand what clients and prospects go through, and adjust accordingly.
To identify your audience, tailor KPIs based on specific goals for customers, financials, and stakeholders. Ask, “What are the three most crucial factors to improve?” in early-stage startups, happy customers are key. If your customers are satisfied, revenue will naturally follow.
Vanity metrics VS Actionable metrics:
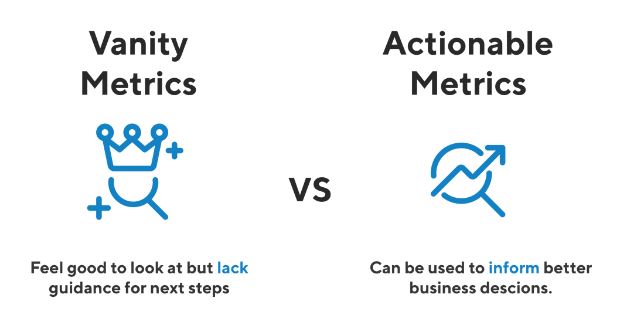
Avoid focusing on vanity metrics and don’t rely on numbers that just look good but don’t really mean much such as likes. Choose metrics that directly connect to how well your business is doing, and that will be your KPIs.
Vanity metrics are like shallow and confusing measurements that can make a team think they’re doing well when they might not be. This can make them stop trying to make things better. On the other hand, a good KPI prompts action. If changes don’t inspire action, reconsider your KPIs. Examples include marketing ROI and sales performance.
actionable metrics are clear measurements that give useful information about business goals. Teams can use this data to make smart decisions about where to take their product or organization.
Quality Over Quantity:
KPIs matter, but they should focus on doing things well, not just getting bigger. The most crucial stuff in life and business can’t always be measured. If you care too much about KPIs, you might forget about important things that are a bit tricky to measure. This could end up harming your business more than KPIs can actually help.
This KPI dilemma can make a great contribution in your business. When you start planning to build a business, look back at previous experiences on different occasions and you can figure out what worked for you and what did not!
Engagement KPIs for Mobile Apps:
There are various key performance indicators (KPIs) that measure how users interact with the app, considering factors such as when, where, and how they use it, as well as the ways in which they connect or engage. To enhance clarity, it’s advisable to focus on a limited number of variables.
Meanwhile, Avoid overwhelming dashboards with numerous variables. Select three to five key variables that matter and can be influenced, based on your observation and understanding of the market, making changes as necessary

Identify SMART KPIs
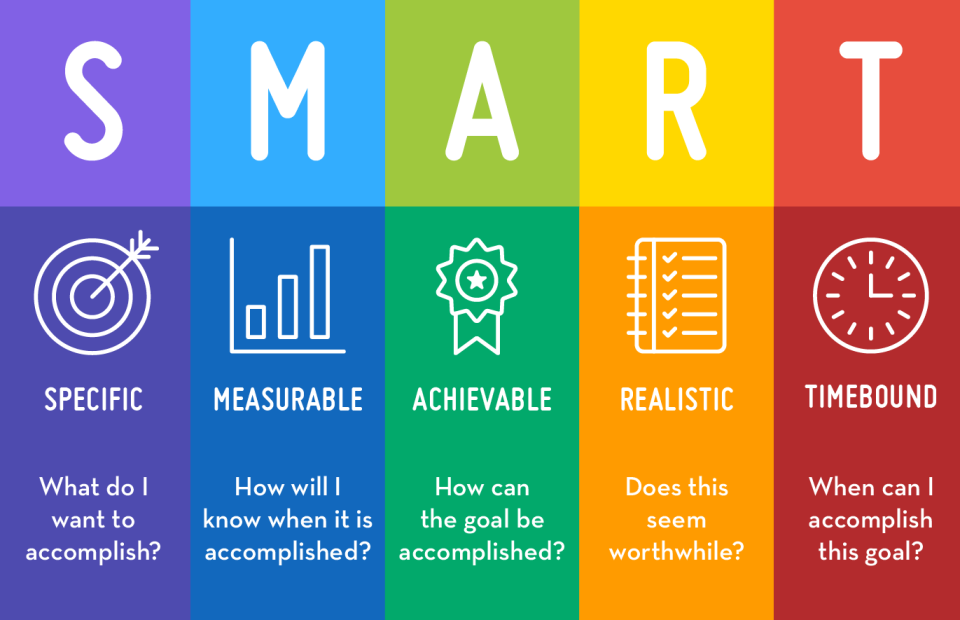
The next step is to pick KPIs that are SMART: specific, measurable, achievable, relevant, and time-bound. Specific KPIs are clear and easy to understand, so everyone knows what they mean. Measurable KPIs are things you can count or check, so you can see how you’re doing.
Achievable KPIs are things you can realistically reach, so you can set goals that make sense. Relevant KPIs connect to your plan and goals, so they really matter for your budget. Time-bound KPIs are tied to a specific time, so you can watch how you’re doing and make changes if needed. Therefore, determine which metrics are most important to your business.
Balance your KPIs
The next thing is to make sure your KPIs cover different areas and viewpoints. Don’t just focus on one money aspect, but look at your whole business. For example, you can use a balanced scorecard that splits your KPIs into four groups: financial, customers, inside stuff, and learning and growth.
Money KPIs check how well you’re making and using money, like revenue and profits. Customer KPIs check how happy and loyal your customers are, like satisfaction and if they stick around.
Inside KPIs check how well things are running and the quality, like how fast you work and if there are mistakes. Learning and growth KPIs check how creative and better you’re getting, like how involved your employees are, if they’re learning, and if you’re making new things.
Keep your KPIS up to date
Step four is all about checking and improving your KPIs regularly. Your KPIs shouldn’t stay the same, they should be flexible and change with what’s happening. Look at your KPIs from time to time and see how they match up with what you’re actually doing. Ask your team and others for their thoughts, and use their ideas to make your KPIs better.
If you need to, make changes to your KPIs, and let everyone know about the changes clearly. Additionally, make sure your KPIs are measurable and actionable to have a better review and refinement for your KPIs.
Use KPI dashboards and reports
Step five is all about using special tools called KPI dashboards and reports to see and share your KPIs. These tools make your KPIs easy to understand with pictures like charts and graphs. They help you keep an eye on your KPIs quickly, find trends or unusual things, and show your KPIs to your team and others.
You can make these dashboards and reports fit your needs and use them a lot to keep everyone updated. Hence, identify your KPIs and analyze trends, patterns, and the behavior of your audience is important.
Learn from your KPIs
Step six is about using what you learn from your KPIs to make your budget and how well you’re doing better. Your KPIs aren’t just numbers, they’re like clues that tell you what’s going well and what needs fixing. They show your strengths, weaknesses, and where you can do better.
Use your KPIs to cheer about what you’ve done well and figure out where you can do better. Make new goals using your KPIs and make plans to fix things if needed.
Elect the right tools and platforms
Next, pick the tools and places to keep track of and understand your product numbers and goals, store, analyze and visualize your product metrics and KPIs. Depending on your product, you might need different tools for things like checking how people use it, getting feedback, testing, and reporting.
Choose tools that work well for what you need, fit your budget, and can be easily connected. Make sure the tools are safe, reliable, accurate follow the rules, and can handle more as your product grows.
Which KPI?
The right KPI examples for every use case depend on function, industry, or platform.
To choose the right metrics and KPIs, think about your purpose, audience, and context and it is necessary to pay attention to top points. Your purpose is the reason why you are measuring your performance and progress. Your audience is the people who will use or benefit from the information.
Your context is the situation or environment in which you operate. Depending on these factors, you may need different metrics and KPIs for different purposes, audiences, and contexts.
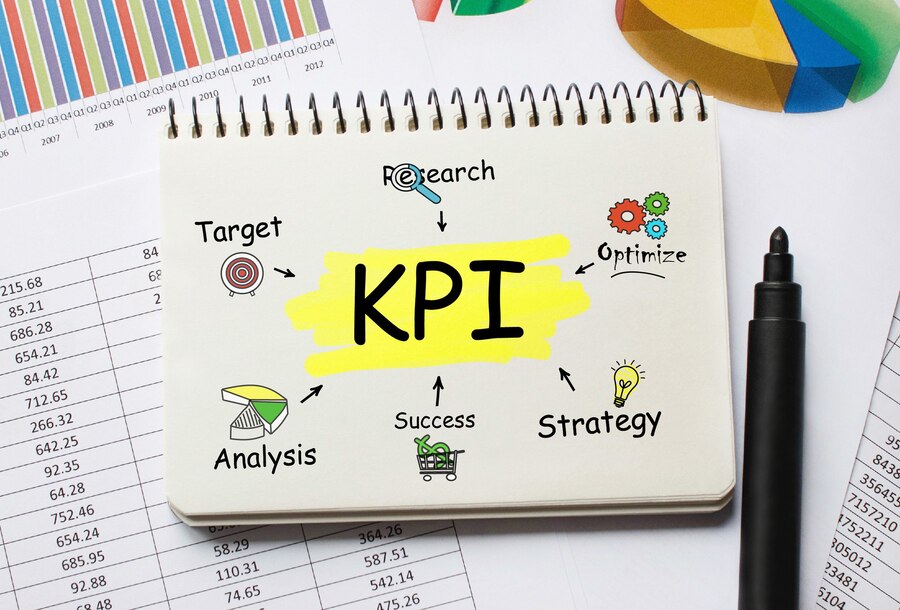
On the one hand, the KPIs are categorized and some essential subscriptions of them are explained. This will help you make better choices when selecting goals for your business.
1- General Mobile Game KPIs
Let’s start by looking at basic KPIs for mobile games if you are a game maker or seller.
Downloads
This is crucial for your business to know how many times people downloaded your mobile games. It is the first sign of your game’s popularity and success. To get more downloads, you need a great marketing strategy for your mobile game.
Installs
The concept of downloads and installs might seem similar, but they are different. Downloading does not guarantee the installation process. It is important to track both downloads and installs on user’s devices. Monitoring uninstalls is useful too, and helps understand why people remove the game.
Subscriptions
Tracking the number of users subscribing and unsubscribing for additional content in your mobile games. Additionally, understand the time it takes for users to subscribe and the factors influencing their decision.
Registrations
It is great for game publishers to find different ways to encourage users to register, not just play as a guest. It provides access to their email address and helpful data. In addition, when users register, it shows they are interested in the game and intend to stay engaged.
2- User Engagement Mobile Game KPIs
After installing a mobile game, the primary objective is to keep users engaged for monetization. Essential KPIs measure user absorption and engagement levels, which are crucial for sustained success.
User Retention
Retention rate, a key engagement metric, shows how many players return to a game after a set time. Commonly measured on days 1, 7, 28, 60, and 90, high retention indicates a thriving game with earning potential.
Sessions (App Open Rate or AOR)
How often people use your app, known as the number of times they open it, is a big sign of how much they like it and how often they come back. The more times users open and use the app, the better. In digital tracking, a ‘session’ means a bunch of actions a person or device does on your app in a certain time.
Session Interval
Think about how much time passes between when people use your app. Do they use it every day, every week, or more than once a day? Usually, it’s better if people use the app more often. But, it also depends on when you have new things in the app or special events. For example, if there’s new stuff every morning, then people might use it once a day. But if your app doesn’t depend on a specific time or event, it’s better if people use it more often.
Session Depth
Session Depth is how much you do in the app each time you use it in your journeys before closing apps. It’s like how far you go into a game or what actions you take, such as buying something or reaching a higher level. This shows how much you get done in one go. For example, if you’re just checking for new stuff, it might not be as deep as when you buy something or play a game for a longer time
Average Session Length (ASL)
Average session length (ASL) reveals how long users play a game from start to finish. It’s the average time a player spends in one gaming session.
Playtime
laytime is the total time a user spends playing a game each day, combining all sessions. In 2022, top mobile games saw users spending about 27 minutes daily, a slight decrease from 2021. For the middle 50% of games, average playtime remained at 14 minutes, consistent with 2021. The bottom 25% of games had approximately 8.5 minutes of playtime.
Install Ratio
Install rates show the percentage of users who choose to install an app after visiting the App Store or Google Play. It’s like a conversion rate. Different install rates exist based on where users come from, like referrals, paid ads, browsing, or searching. The install rate tells you how well your app stands out in the app store search/browse results.
Install Rate: App Unit/Impressions
Why it is important:
Different sources bring different users to a product page, resulting in varying install rates. Browser rates are generally low, given the broader audience. Search rates are higher due to user intent. Referral rates depend on the ad channel quality. Understanding these variations is crucial for effective user acquisition strategies.
3- Advertising and User Acquisition KPIs
The first task in mobile marketing is getting people to download your app. Because there are many apps, spending money on advertising is necessary. Checking how well ads work can save money and make your earnings go up.
CPM
CPM means cost per thousand impressions. It’s the average cost for a thousand ad views or the amount you pay for every thousand times your ad is seen by internet users. To calculate CPM, divide the cost by impressions and multiply by a thousand.
CPM = (cost ÷ impressions) × 1000
Why it is important:
PM is often used in campaigns meant for thousands of viewers. Let’s explore how it works, its ideal campaign types, and where the results come from. We’ll also discuss how CPM connects to digital marketing and fits into a broader company marketing strategy.
Cost per install (CPI)
The Cost Per Install shows how much it costs to get a customer who downloaded your app after seeing an ad (counting paid downloads, not the ones that happen naturally). Briefly, How much it cost to get one new installation?
CPI = Total campaign spend / Number of app installs
Why it is important:
CPI helps figure out how much it costs to get a new user, so you can make the most of your marketing money. If you’re trying to get more people to install your app, you want to make sure you’re not spending too much for each installation, which could hurt your overall profit.
Cost per completed view (CPCV)
CPCV means Cost Per Completed View. To find CPCV, divide advertising cost by completed video views. Advertisers pay when a video is viewed to the end. CPCV helps advertisers make a big impact on audiences and get the best return on investment (ROI) for their campaigns.
CPCV = Ad Cost / Completed Video Views
Cost per click (CPC)
Cost-per-click (CPC) means you pay for each click on your ads. In CPC campaigns, set a max. CPC bid, the highest you’re willing to pay for a click. The actual cost per click (CPC) is often less than your bid. Choose between manual bidding (you pick bids) and automatic bidding (let Google set bids). CPC is also called pay-per-click (PPC).
CPC= total ad spend / total number measured clicks
Why it is important:
CPC is one of the most important used metrics. It is because, cost control, understanding ad performance, focusing on an engaged audience, and maximizing ROI. It ensures advertisers pay for actual clicks, providing value and control over budgets. Monitoring clicks helps assess ad effectiveness, allowing quick adjustments to campaigns. Clicks, unlike impressions, indicate user engagement and intent, improving the potential for conversions. Managing CPC helps safeguard budgets and optimize returns on marketing investments.
Cost per Engagement (CPE)
The meaning of cost per engagement (CPE) is a way to pay for ads. In all industries, advertisers only pay when people interact with their ads.
CPE = total cost spent / total measured engagements
Why it is important:
CPE pricing brings flexibility, creativity, and budget control. Advertisers define engagement, by adapting to trends. Every interaction boosts brand awareness and goals, ensuring budget efficiency as payment is linked to meaningful interactions.
Cost per Acquisition (CPA)
The cost per acquisition of a conversion. How much does it cost to get someone to do something new in the app, like signing up for a subscription or buying something? It might not always be a new customer, but it’s about getting them to do a new thing.
CPA= Cost / # of Acquisitions
Customer Acquisition Cost (CAC)
How much it cost to get a new customer, like the money spent on ads for your app, including the time spent on marketing (because time is also money). You find this number by dividing the total money earned in a certain time by the costs of sales and marketing in that same time.
CAC= Cost of Acquiring a New Customer / # of New Customers
Effective customer Acquisition cost (eCAC)
The real cost of getting new customers, includes organic discovery methods, ads you pay for, and the time or money spent on marketing. You figure this out by looking at how many new customers, you get compared to how many people see your ads by marketing campaign, and considering how much the ads cost.
Customer Lifetime Value (CLV)
A customer’s lifetime value is determined by the profit they make over time, which in this case is based on their spending on and in the app proportional to the cost of acquisition. Having a lot of users who spend a good amount is great for a mobile app. Also, remember that successful apps often have a really good ratio between how much users are worth and how much it costs to get them, and keep in mind often successful apps tend to have excellent CLV and CAC ratios.
CLV= Avg value of a Conversion X Avg # of Conversions in a Time Frame X Avg Customer Lifetime
Installs per mille (IPM)
How many times your app gets installed for every 1,000 times people see an ad.
IPM = (Total installs / Total impressions) * 1,000
Why it is important:
IPM tells us how well a campaign is doing – the higher, the better. If it’s low, it might mean people aren’t very interested in the ad. Make sure you’re showing it to the right people or consider changing the ad itself for better results (learn more about IPM and making ads work better).
Organic conversion rate
People who start using your app without clicking on ads because they found it by accident. Those who discovered it through online searches, social media, or news sources are included here.
Organic conversion rate = Number of conversions / Number of interactions with organic source
Why it is important:
Organic conversion rate shows how good you are at getting new users without paying for ads. It helps you see where you can bring in more people to use your app without spending money to get them.
Cohorts
mobile marketing, a cohort is a group of users brought together by a shared trait. This trait could be anything, like users from a specific place or those who installed an app around the same time.
Why it is important:
Cohorts in mobile marketing help analyze user trends over time, allowing marketers to assess the impact of changes. By examining the same group of users, you gain insights into the effectiveness of optimizations, recognizing variations in engagement rates throughout different stages of users’ lifespans.
K-factor
“How many people start using your app without seeing an ad because someone else who already uses it told them about it. For instance, if your game allows playing with friends, and someone invites three friends who then download the app, you now have three new users without having to pay for ads.
K = number of invites sent by each user / conversion rate of each invite
Why it is important:
A big K-factor means a lot of people are talking about and sharing your app, making it spread more without spending too much on ads. Let’s say you paid $3 to get one person to install your app, but that person told two friends who also installed it without you paying for ads. In the end, you spent $1 for each of those three installs.
Return on Investment (ROI)
In this situation, we’re figuring out if the money and effort you put into marketing were worth it. We do this by seeing how much you gained in customers or money compared to how much you spent on marketing, including time and any other costs.
ROI = (Gain from Investment – Cost of Investment) / Cost of Investment
Retention rate
The part of people who come back to your app within a certain time after they first install it. We usually check this at 1, 3, 7, 14, and 30 days after they started using the app.
Retention rate = [(Number of users at end of period X – Number of users acquired in period X) / Number of users at start of period X] * 100
Why it is important:
A good retention rate means people keep liking and using your game, which is important for making money. It also helps figure out if your users are really good, so you can plan better on how to get more of them. A higher retention rate is really good and means your app can make more money in the future..
Retention Rate = ((CE – CN) / CS)) X 100
CE = number of customers at the end of the period
CN = number of new customers acquired during the period
CS = number of customers at the start of the period
Churn/Uninstall rate
How quickly do people delete your app within a few days of getting it.
Churn rate = (Number of users who uninstalled during period X / Number of users at start of period X) * 100
Why it is important:
Games, especially casual gaming apps, often have the most people uninstalling them on mobile phones. This is a problem because you spent money to get those users. Figuring out why users delete your app and when it happens can help you fix problems and keep the good users.
Daily active users (DAU)
How many people use the app every day. Adding up the daily users and finding the average over a month or year is a usual way to figure out how valuable the app is or predict how much it might grow.
If one person uses the app three times in a day, we still count them as just one daily active user.
Why it is important:
In games, it’s good if people play your game a lot, like every day. DAU tells you how many users have your game and play it daily. This helps you see how good your game can be if more people keep playing. You can also use DAU to check if a new feature or campaign is popular – if it is, you’ll see more people playing the game every day.
Monthly active users (MAU)
How many people use the app every month? We count them as unique visitors, even if they visit multiple times. It’s important to look at both numbers. If someone uses the app on five different days within a month, we still count them as one Monthly Active User.
Why it is important:
MAU shows how many people use your app in a month and gives a broader view than DAU. It also tells you how much people like sticking around and using your app regularly.
Stickiness
How many days do audiences use your app in a month? To find out, you can divide the number of daily users (DAU) by the monthly users (MAU) and then multiply by 30.
Stickiness = (DAU / MAU) * 30
Why it is important:
Stickiness tells you how much people like playing your game and how much it matters to them. If stickiness is high, it means people really enjoy your game and come back to play it a lot.
ATT opt-in rate
The part of iPhone users who say ‘yes’ to letting an app watch what they do, following Apple’s privacy rules. The app can then use the user’s Apple IDFA for different things, like figuring out where they came from or showing them specific stuff.
ATT opt-in rate = Number of iOS users who opt-in to tracking / Total number of iOS users
Why it is important:
if people say ‘no’ to tracking, advertisers and app makers can’t see detailed info about users or devices for their ads. Instead, they have to guess and use general data. If more people say ‘yes,’ you get more direct info about each user, which helps understand how they use the app and what they like.
4-Revenue and Monetization Mobile game KPIs:
You’ve found the right users, improved your app, and got users without spending too much money. Can you relax now? Not really. To keep your game going, it needs to make money. Since many apps are free to download, the main ways to make money are through ads or things people buy in the app.
But making money isn’t free, so you have to spend your money wisely. Let’s look at some key numbers that help you make sure you’re getting more money than you’re spending.
Average revenue per user (ARPU)
How much money does each user bring in through buying stuff in the app, seeing ads, subscribing, paying for downloads, or other ways to make money? If you multiply this by the number of users, you get a good estimate of how valuable the whole app is.
ARPU = Total revenue / Total number of users in cohort
Why it is important:
ARPU is a simple way to see how much a player is worth over a certain time and plan how much to spend on getting more players. It counts all the money-making things in the app, like purchases, ads, subscriptions, and paid apps. Once you know this number, you can find ways to make it better for users as they use the app
Average revenue per paying user (ARPPU)
The average money earned from a player who bought something in the game. You get this number by dividing the total money earned by the total number of players who spent money.
ARPPU = Total revenue / Total number of revenue-generating users
Why it is important:
ARPPU helps see how well things you can buy in the app are working, both the ones that are already there and the new ones. It also checks if other things, like watching an ad instead of paying, affect how much money is made from buying stuff. This is handy in games where some people pay and some don’t.
Lifetime value (LTV)
How much money a user has made for your app since they started using it. When you add this to the average money each user makes, it helps figure out how much money the app might make in total
LTV = Number of days of engagement * Average spend per day
Why it is important:
LTV (with ARPU) shows how much money a game or a user makes overall. It helps you figure out how much you can spend on getting more users and still make a profit.
Time to first purchase
The time it takes a user to make their first in-app purchase after installing a game.
Why it is important:
The time it takes for someone to make their first purchase helps you decide where and when to ask them to buy things in the game. It also shows when it’s a good idea to include in-app ads to make the game better. Getting the timing right is important: if you ask too soon, people might not like it, but if you wait too long, they might not be interested anymore or not see why they should buy something.
Date/Time of First Purchase – Date/Time Registered (in days)
Effective cost per mille (eCPM)
The real cost for every 1000 times an ad is shown or people take action, including both free and paid efforts and the time or money spent. You can find this out by dividing the number of times the ad is shown or viewed by how many customers you get.
eCPM = (Total ad revenue / Total impressions) * 1,000
Why it is important:
eCPM is a simple way to see how much your traffic is worth and figure out your CPM (cost per thousand). CPM is the price an advertiser is ready to pay for 1,000 times their ad is shown, and eCPM is how much the publisher earns for every 1,000 views.
Share of paying users
The part of people who downloaded the app and then bought something in it since the install.
Share of paying users = (Number of installers who make an in-app purchase within period X / Total number of installers in period X) * 100
Why it is important:
This shows if the users who come from ads are good, and it helps see how well your money-making plan is working. Think about how to make your ads better so that more people buy things.
Return on ad spend (ROAS)
The money used for ads and marketing, is divided by how much money users make during a specific time (like if a player brings in revenue equal to half the money spent to get them, it’s a Day 7 ROAS of 50%.
ROAS = Total marketing spend / User-generated revenue in period X
Why it is important:
ROAS is a crucial KPI and way to see if your ads are making money. For game apps, ads often cost a lot. By always checking how much money your ads make compared to what you spend, you can decide how well your ads are doing and put more money into the best ads and places.
5- User Experience KPIs:
Whether a mobile app does well or not mostly depends on how users feel about it. So, keeping an eye on these KPIs and others to understand, measure, and make it better could be the most important thing for a mobile app developer or marketer.”
Load Time
How quickly an app opens up when you tap on it and is ready to use, including how fast you can move between different parts of the app. Simply put, the faster the app opens, the better it is for users. It’s usually best to make the app load as fast as it can.
Devices
A pretty easy thing to figure out and keep an eye on is knowing which devices people use to get to your app. It’s important to know if they use tablets or phones, Android or iPhone, or other devices. Then you can make sure your app works well for them.
Carriers
Just like knowing which devices people use for your app, it’s also good to know which phone companies they like. This is especially important if you’re aiming for a specific area.
OS
Mostly, it’s about whether people use Android or iOS, which is important for both users and developers. Your app should be good on both. If a lot of people are having issues or deleting the app on one of them, or if people really like one over the other, it’s worth looking into. Figure out why and fix any problems that might be causing these preferences.
Screen Dimensions/Resolution
This KPI is usually about the devices your customers use for your app. But, it’s also good to think about when you’re making updates and new versions. You can check how it relates to other app performance measures like how many people uninstall it or if it crashes.
Permissions Granted
The amount of access or permissions that your customers let your app do or see.
KPI pyramid
On the flip side, let’s discuss the KPI pyramid. By understanding this, you can find a simple way to easily keep track of your KPIs in your business, especially in your business games.
What is the KPI pyramid?
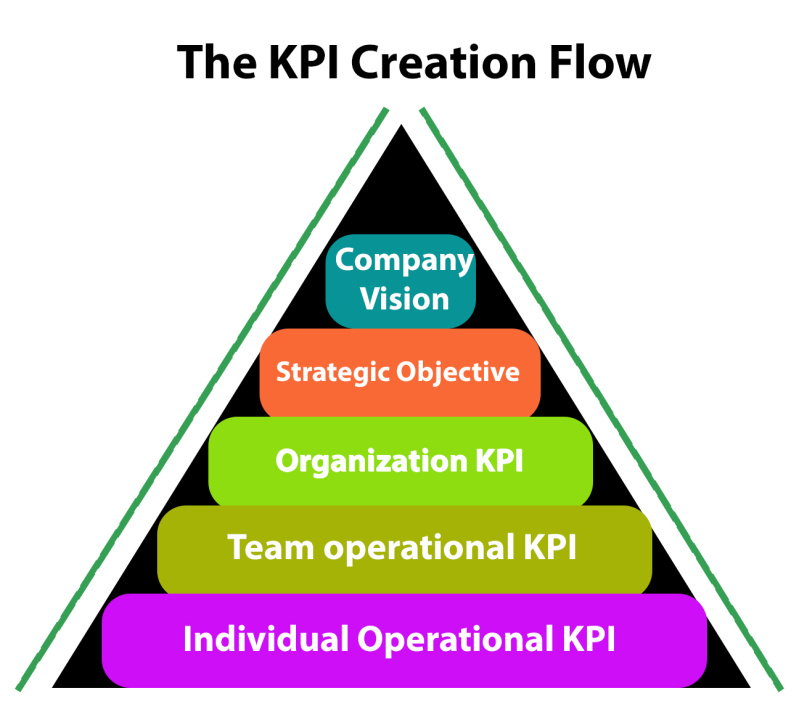
The KPI pyramid is a framework that helps you to rank and prioritize your products in a clear way. It has four levels: vision, objective, key results, and key performance indicators. These levels cover various aspects of your product success, from long-term vision to short-term actions.
They are connected, with each lower level supporting the higher one. The KPI pyramid helps you match your metrics with your product strategy, concentrate on crucial outcomes, and express your progress clearly. The KPI pyramid helps you indicate your metrics with your product strategy, focus on the most important outcomes.
How to build a KPI pyramid?
To create a KPI pyramid for your product, begin at the top and move down. First, create a clear and inspiring product vision.
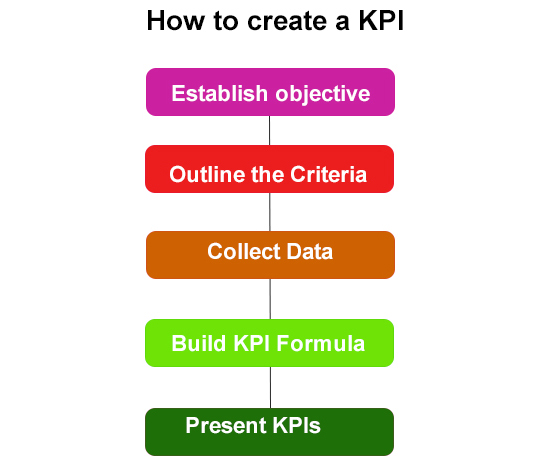
Then, set objectives that align with your vision and show the value you aim to provide. Define key results that are SMART: specific, measurable, achievable, relevant, and time-bound. Lastly, select key performance indicators that are easy to measure, understand, and can drive action.
How to use the KPI pyramid?
The KPI pyramid is a vital tool for product managers to gauge and improve their product’s success. It aids in communicating the product vision, objectives, and key results to the team and stakeholders, ensuring alignment and accountability.
Additionally, it guides decisions, prioritizes impactful features, and focuses on initiatives. The KPI pyramid also helps monitor product data and feedback, pinpoint areas for improvement, set targets, and compare results. It is indispensable for product managers committed to ensuring success.
Conclusion:
In conclusion, effective key performance indicators (KPIs) serve as invaluable signposts on your business journey, facilitating accurate and prompt decision-making.
Choosing the right KPIs, such as new customer numbers and sales increases, acts as a strategic guide for achieving specific objectives, like growing your market. Regular monitoring and strategic alignment ensure your organization stays on course, providing key insights into KPIs in the dynamic Mobile Game Industry.
