In the fast-paced world of mobile games, developers and marketers have some tough challenges. One of the most important challenges is making enough money to keep the company going strong.
Understanding the behavior of paying users in different genres is essential for diving deeper into the monetization strategy.
Among the critical metrics for mobile marketers, ARPPU stands out, particularly for businesses with a free-to-install app and a low proportion of paying users.
Knowing the characteristics and spending habits of paying users in different genres of mobile games can provide valuable insights for making informed decisions regarding effective engagement and re-engagement campaigns.

In this article, we will first compare ARPPU in broad and niche appeals. Additionally, we will list some genres in each category to provide insights for developing your business in the mobile game industry.
On top of these, I will compare different genres each year using data collected from Statista and Adjoe in the US from the years 2020 to predicted data for 2027.
Due to its assistance in helping developers and marketers make informed decisions about monetization strategies based on the behavior of the audience in different genres, we will revisit our previous article to explore the relationship between these metrics and different game genres.
After that, we’ll examine ARPPU along with other important metrics to shed light on its significance. By doing so, we aim to provide a comprehensive understanding of ARPPU and its implications for successful mobile game monetization strategies.
Table of Contents

Niche Appeal vs. Broad Appeal:
Niche Appeal:
The concept of “Niche Appeal” and “Broad Appeal” refers to the target audience and popularity of something:
• Definition: When something has niche appeal, it is designed for a specific, specialized, or unique audience.
• Audience: It caters to a small group of individuals who share a particular interest, passion, or preference.
• Size: The audience is limited but highly targeted.
• Category of niche mobile games: MOBAs(Multiplayer online battle arena), Arcade, Bingo, 4X strategy, social casinos, Slots (a gambling machine that creates a game of chance for its customers), poker, and RPGs games.
In the gaming landscape, carving a niche with limited appeal and low monetization is a challenging journey. Standout examples, like the Archero games, showcase success. These games, with straightforward mechanics, achieved scale through inventive marketing and hybrid monetization. The scarcity of similar examples underscores the uniqueness of this category.

Broad Appeal:
• Definition: Having broad appeal means that something attracts a wide-ranging or universal audience.
• Audience: It resonates with a large and diverse audience, transcending specific interests or preferences.
• Size: The audience is extensive and includes people from different backgrounds, demographics, or tastes.
• Category of broad mobile games: Hyper-Casual, IDLE, Word games, lifestyle games, simulation, sports, puzzles, and shooters.
Games that attract a wide audience and generate modest revenue can experience rapid growth through ad monetization.
Standout examples of success include Wordscapes and Board Kings, known for their effective monetization strategies.
All in all, by reviewing previous articles that were written about genres, we discovered that niche appeal focuses on a specialized and smaller group with specific interests, while broad appeal targets a larger and more diverse audience with widespread appeal.
Discovering the sweet spot, these genres achieve future success with broad appeal and a moderate to high monetization rate. Keep an eye on sub-genres featuring moderate entry barriers and low concentration levels. Successful examples include Merge Mansion, as well as popular genres like Free Fire and Royal Match.

Therefore, developing fantastic technology is just the beginning of creating an impactful product. Knowing how to make groundbreaking things doesn’t guarantee success; understanding how users will solve problems and ensuring long-term profits from your games and your products is vital.
Many companies fail by launching technology based on guesses, not market needs. To truly change the world, engage with the market, solve its problems, and plan carefully.
Analyzing Annual Genre Trends in the US
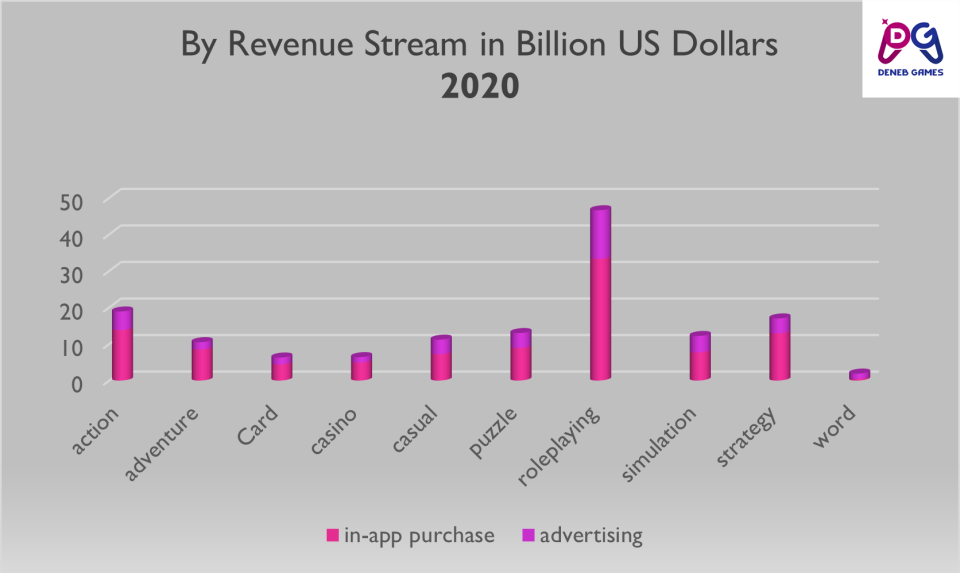
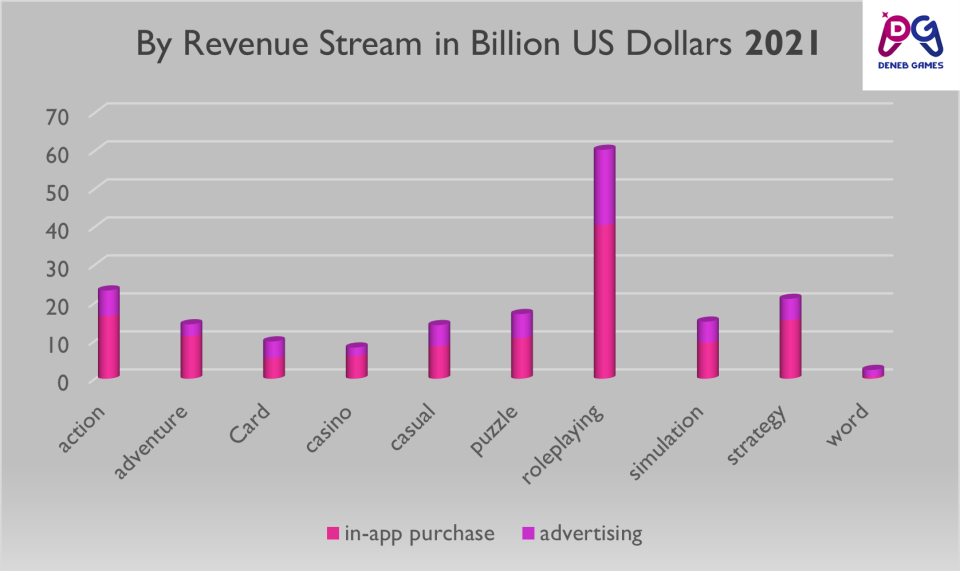
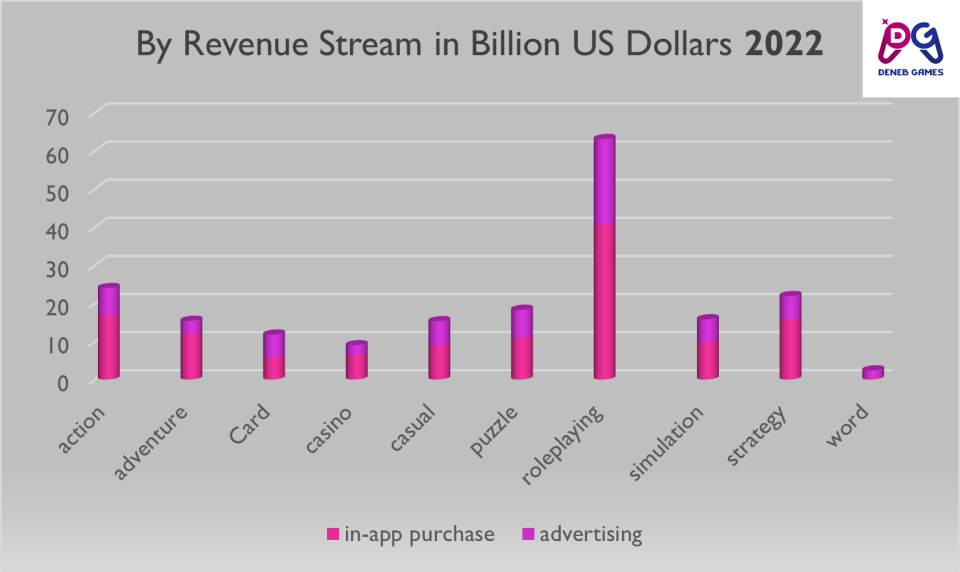
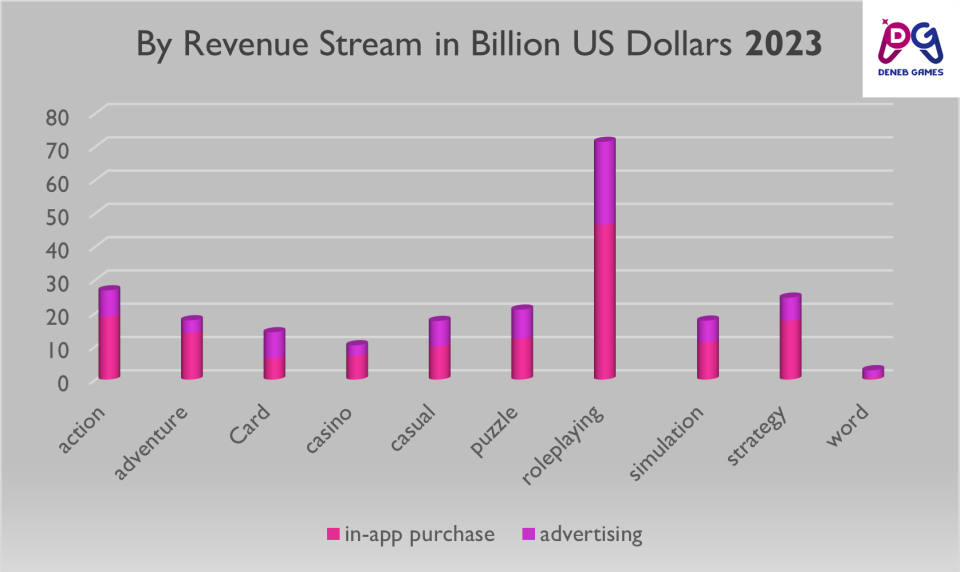
I will compare genres annually using data collected from Statista and Adjoe in the US from 2020 to the predicted data of 2027, aiming to understand audience preferences. The analysis will include in-app purchases and advertising amounts, providing a comprehensive overview of these metrics each year.
In 2020, the roleplaying mobile game genre excelled financially, generating a substantial $13.3 billion from advertising and an impressive $33.3 billion from in-app purchases in the US. This dual revenue source underscores the industry’s triumph in captivating players and leveraging in-game transactions.
In 2021, the roleplaying mobile game genre achieved significant financial success, earning a substantial $19.8 billion from advertising and an impressive $40.4 billion from in-app purchases in the US. This reflects a notable percentage increase compared to the previous year.
In 2022, roleplaying mobile games did really well, making a lot of money—$22.4 billion from ads and a big $40.7 billion from in-app purchases in the US.
In 2023, the roleplaying mobile game genre did really well financially, making a lot of money—$24.9 billion from ads and a huge $46.2 billion from in-app purchases in the US.
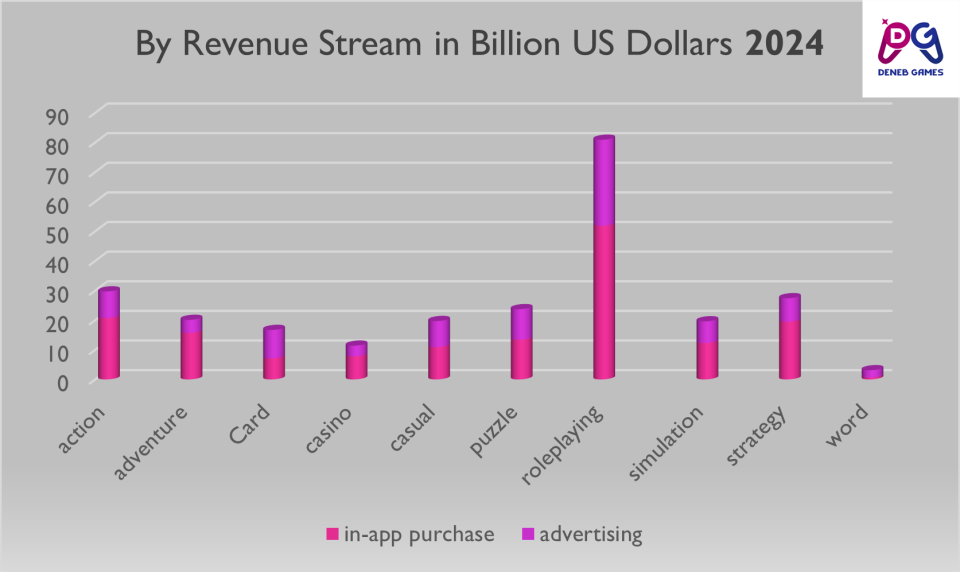
In the year 2024, roleplaying mobile games will make a substantial amount, projected at $29 billion from ads and an impressive $51.9 billion from in-app purchases in the US.
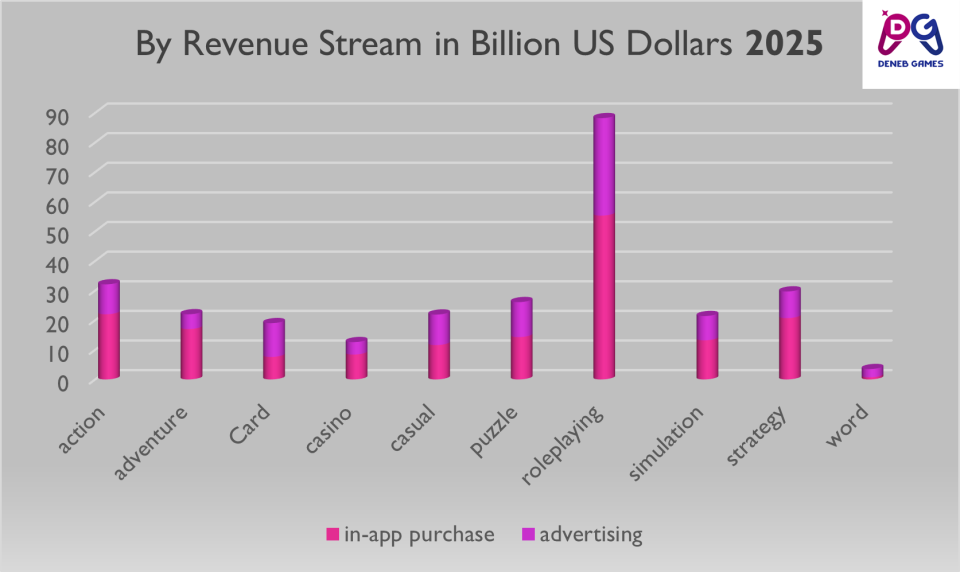
In 2025, roleplaying mobile games are anticipated to generate a significant sum, with projections of $32.9 billion from ads and an impressive $55.3 billion from in-app purchases in the US
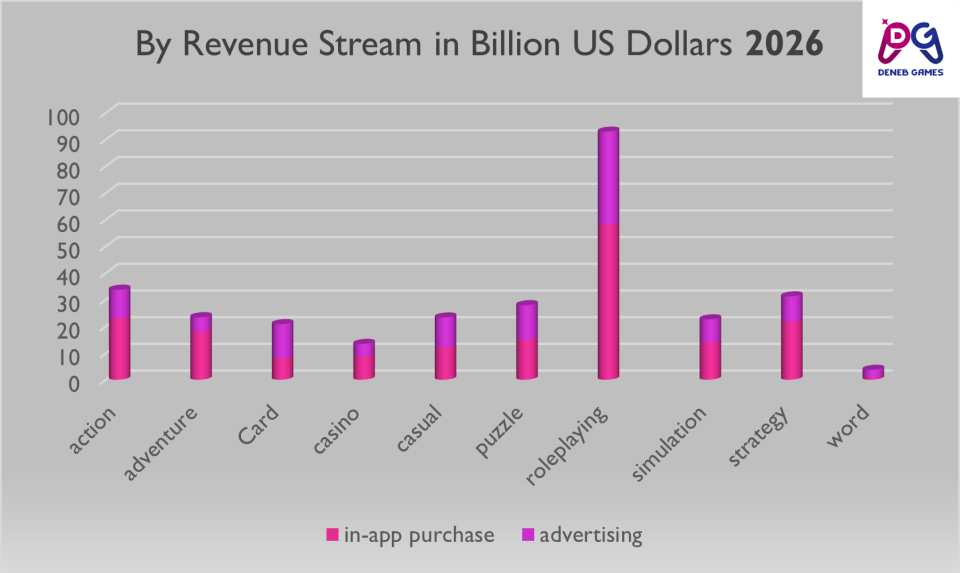
In 2026, roleplaying mobile games are expected to generate a substantial sum, with projections reaching $34.8 billion from ads and an impressive $58.1 billion from in-app purchases in the US.
In 2027, roleplaying mobile games are expected to generate a significant sum, with projections reaching $38.1 billion from ads and an impressive $60.4 billion from in-app purchases in the US.
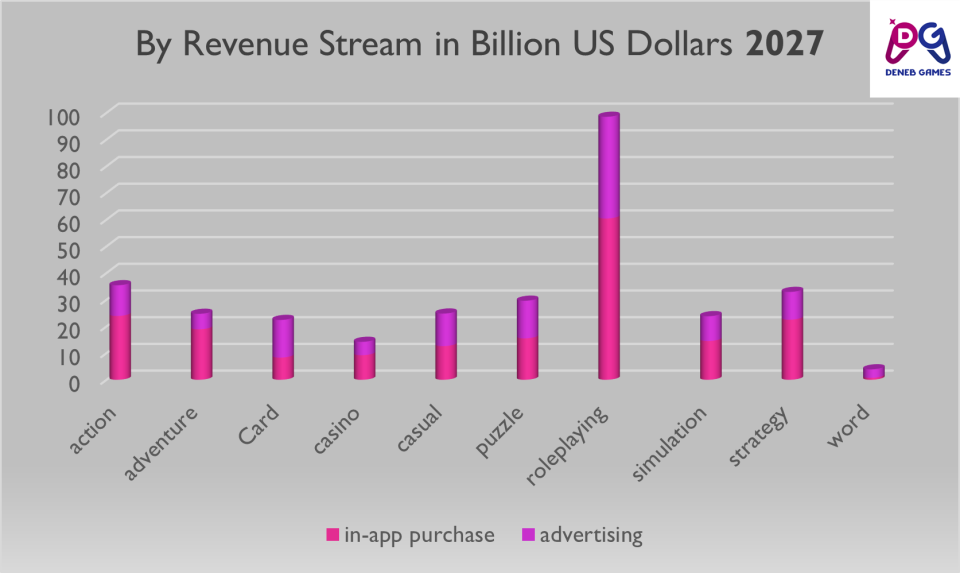
Comparing this data shows that roleplaying games make more money, while genres related to word games bring in less revenue.
Here, various genres are thoroughly explained. If you are following this topic, you can find all the details here.
What is the Average Revenue Per Paying User (ARPPU)?
In the mobile game industry, Average Revenue per Paying User (ARPPU) is a way to figure out how much money, on average, comes from each player who spends money in the game. It’s like a special tool or marketing metric that helps game companies see which players bring in the most money.
ARPPU is a simple measure used by mobile game businesses to find out who their most important customers are and what kinds of players spend money. It’s a way to see how well the company is doing in making money from players who actually spend in the game.
Think of ARPPU as a special money measure focusing only on players who pay, not everyone who plays the game. It helps game companies understand how much profit they get from each paying player and how good they are at making money overall.
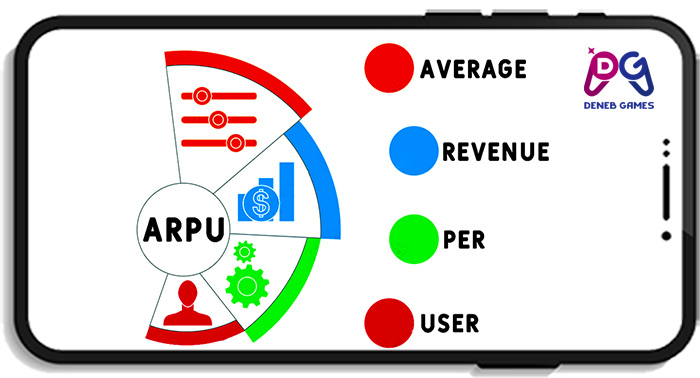
A Deep Dive into Revenue and ARPPU Metrics
ARPPU, or Average Revenue Per Paying User, is a critical metric used in the gaming and app industries to measure the average amount of revenue generated from each paying customer.
It is calculated by dividing the total revenue generated by the number of paying users.
This metric is particularly important for businesses that rely on in-app purchases or subscriptions as their main revenue drivers.
By having a clear understanding of how much a paying user is worth to the business, marketers, and advertisers can make informed decisions about customer acquisition and profitability. It also allows businesses to identify their most valuable customer segments and buyer profiles.
ARPPU is a useful measure to demonstrate how much loyal customers are willing to pay for a service, therefore validating a developer’s pricing model, and it can also highlight reactions to pricing decisions.
The usefulness of Average Revenue Per Paying Use:
Analysts often prefer ARPPU because it focuses specifically on paying customers. However, companies don’t frequently report ARPPU compared to ARPU.
ARPPU serves various purposes:
- Peer Company Comparison: ARPPU is valuable for comparing companies in the same industry. A higher ARPPU is generally considered desirable.
- Financial Modeling and Forecasting: ARPPU plays a role in financial modeling and forecasting, helping generate accurate revenue predictions.
- Profitability and Revenue Analysis: Analyzing ARPPU over time helps determine a company’s profitability and its capacity to generate revenue. This trended analysis provides insights into the company’s financial health.
Why ARPPU is important:
ARPPU is all about what really matters – revenue. So, this KPI metric has evolved into a fundamental tool for app markets.
It is especially crucial for those assessing revenues from freemium games or heavily depending on in-app purchases as their primary revenue sources. The metric helps them gain insights into Return on Investment (ROI) and make informed decisions to enhance their app’s performance in the competitive market.
It helps you zoom in on smaller groups of paying customers, showing how valuable they are to your business. This way, you can focus on making money without getting distracted by the majority who don’t pay.
In areas like gaming, where only a small percentage actually pay, ARPPU is super important. It guides your decisions by revealing which channels, networks, and campaigns bring in the most valuable customers.
You can even figure out the traits of paying users to find more similar ones through lookalike remarketing. ARPPU basically helps you see the money side of things more clearly and make smart choices.
ARPPU is like a money gauge for loyal users. It tells you if your strategies to attract big spenders, known as “whales,” are successful and if your most loyal customers are bringing in enough money.
Also, ARPPU is handy to check if your pricing setup is doing well. It’s simpler to decide on money matters by focusing on the customers who spend the most, instead of trying to please those who might use your app for free no matter what changes you make.
How is ARPPU calculated?
To find ARPPU, you divide all the money earned by how many people paid. It’s a handy way to show how much loyal customers are okay with paying for a service. This helps check if the pricing set by the developer is good. Plus, it shows how people react to changes in prices.
Formula for Average Revenue Per Paying User.
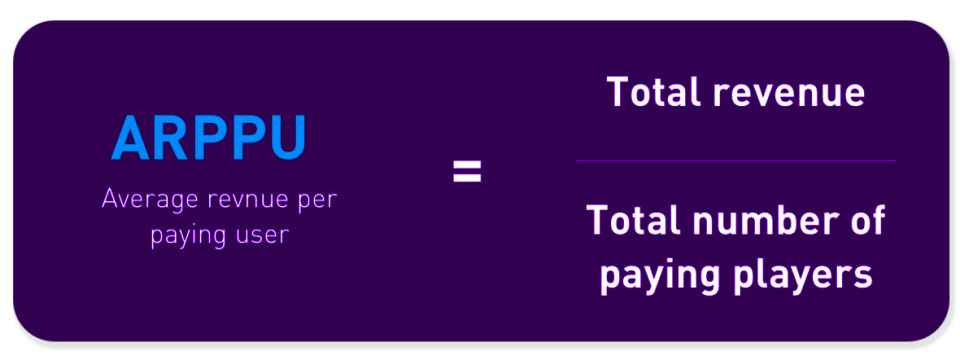
The formula to figure out the average money earned from each player who spends in the game.
On the other hand:
ARPPU=Total Paying Users in Time Period X/total Revenue in Time Period X
This formula provides a straightforward way to measure how much, on average, each paying user contributes to the total revenue during the specified time frame.
For instance, if your app brings in $10,000 each month and you have 200 active paying users, the ARPPU would be $50. Remember, when calculating ARPPU, exclude free users, canceled subscriptions, and inactive subscriptions to get an accurate measure of what each paying user contributes.
Where:
• Total Revenue: This is all the money earned during a specific time.
• Average Paying Users: This is the average count of people who pay for a service or product during that time.
Put simply, Total revenue shows the overall financial picture, but ARPPU zooms in on the paying customers. This detailed look helps create specific marketing plans and improve services for users who spend money. Understanding both Total revenue and ARPPU is key for smart decision-making and long-term success as businesses figure out how to make money.
Unlike Total revenue, which includes all the money coming in over a certain time, ARPPU focuses on the average money each person who pays brings in during that time.
Note that:
• If you’re measuring at just one day, it’s called an average revenue per paying daily active user (ARPPDAU).
• If you’re measuring a whole month, it’s called average revenue per paying monthly active user (ARPPMAU).
Take note that the timeframe you choose is crucial when comparing monthly ARPPU to daily ARPPU, as it can yield different outcomes. For example, in monthly ARPPU, a user making multiple payments within a month is considered. However, if you’re specifically examining the ARPPU for a given day and that user hasn’t made any purchases on that day, they won’t be included in the calculation.
Who is a paying user for you?
It might sound like a simple question, but the answer can vary based on your setup. Is it someone who watches an ad, buys a loot box, or purchases the full game after going through your tutorial?
If everyone pays upfront, it’s straightforward – they are included in your ARPU. However, if they have the option to buy extra things like cosmetics or currency, it could be helpful to separate those groups for a clearer picture.
Remember, you have different types of players with various behaviors and spending habits. It’s crucial to understand what ‘paying users’ bring in:
- Give them extra attention to keep them spending.
- Plan how to turn players who haven’t paid into paying customers.

How do I improve my ARPPU?
Increasing ARPPU is more than simply raising prices. While this could boost your average revenue from paying users, it might also reduce the number of paying users your app has, also known as your conversion rate.
As with every metric, a balanced approach is needed. You can improve ARPPU by consistently refreshing your content, removing revenue ceilings, rewarding your highest-paying users, and even by adding in-app mechanics that encourage spending.
The ARPPU metric is valuable for comparing among peer companies, financial modeling, forecasting, and profitability analysis. It becomes especially significant for internet firms with a sizable mix of both free and paying users.
- Difference Between ARPPU and ARPU: ARPPU focuses on paying users, while ARPU calculates based on your total active users.
- Importance of ARPPU: ARPPU hones in on your monetizing users, who are crucial for your overall success.

- Advanced ARPPU Measurement: For a more sophisticated analysis, consider segmenting your data using cohort-based groups. This is particularly beneficial for understanding your user acquisition (UA) efforts.
- Recognition of Whales in Gaming Apps: Gaming apps should pay attention to their big spenders (whales). Celebrate, incentivize, and invest in them for a positive return on investment (ROI).
- Changing Pricing Structure: Changing prices may lead to losing some customers. Transparency and demonstrating the added value of the price increase can help mitigate the churn rate.
ARPPU for mobile games
The freemium model is widespread in the app market. In this approach, app owners rely on income from in-app purchases (IAP) and in-app advertising (IAA) to generate revenue.
In the gaming world, most of the money comes from a tiny group of users, often as little as 2-5%. Within that small percentage, there’s an even smaller number of users who spend a lot, typically through a bunch of small transactions.
These big spenders are called “whales,” borrowing the term from real-life gambling.
Given this revenue, setup, breaking down users into segments is crucial. Marketers need to be able to pinpoint and separate the big spenders, the “whales.” This also sheds light on which network or channel brought them in.
By doing this, marketers can concentrate their efforts where they get the most bang for their buck, aiming for the highest return on ad spend (ROAS).
Advanced measurement: Cohort ARPPU
The method we explained for calculating ARPPU is handy for product managers, business executives, and marketers. It gathers together all revenues from a specific time, regardless of when users were acquired. That means, no matter when users join.
However, many marketers prefer metrics tied to cohort groups. They might, for instance, want to figure out how much money all users acquired in May brought in compared to those acquired in June. This approach gives a more detailed look at revenue patterns based on when users joined.
To calculate Cohort ARPPU use the following formula:
The formula calculates the total money earned during time period Y by users acquired in time period X. This is then divided by the total number of paying users acquired in time period X.
Analyzing cohorts is especially helpful when trying to understand how well user acquisition (UA) efforts are performing.
For instance, let’s say you tested some new messaging in May when ARPPU was $15. Then, in June, you switched back to the original messaging (without any other changes), and your ARPPU dropped to $12. This indicates that the new messaging in May was more effective in bringing in paying users compared to the old messaging in June.
It’s crucial to mention that the advanced ARPPU calculations based on cohorts aren’t widely accepted as an industry standard. Nevertheless, for marketers, cohort metrics are precious. Therefore, there’s merit in looking at your ARPPU through this perspective too.
How to grow your ARPPU?
Our ARPPU mirrors your business’s approach to making money and shows how much users are willing to pay for your service. In the online business world, there are various ways to earn money, like subscriptions, purchases (including paying for an app), or income from advertising.
Boosting your ARPPU can be done by:
1-Turning non-payers into payers
Converting Non-Paying Users into Payers:
To increase your ARPPU, convert active users into paying customers. You might entice them with special offers for their first purchases. Another strategy is turning occasional payers into big spenders, perhaps by inviting them to become brand ambassadors or influencers and offering perks or discounts. In the case of a gaming app, you could encourage these players by inviting them to participate in a tournament.
2- Celebrating your whales
Acknowledging Your Big Spenders Show appreciation to your big spenders by celebrating them. Make them feel special, encouraging them to continue being significant contributors. Recognize their achievements with status rankings or provide perks to incentivize continued purchases.
Additionally, seek feedback from your big spenders on how to enhance your app or site. Involving them in the product conversation makes them feel valued, and you gain insights from your most important users. It’s a win-win situation!
3- Changing your pricing models:
Increasing your prices is a straightforward method to boost your ARPPU, but it should be done gradually, considering that some users may stop using your service in response. While your ARPPU might stay the same, the revenue is divided among fewer users.
If you decide to raise prices, transparency is key. Clearly explain the added services that justify the price change. This is an opportunity to identify premium features that users might be willing to pay for.
You can also experiment with different bundles to see which ones appeal to different user profiles. It’s often easier to test with new users and observe their purchasing patterns than convincing existing users to change their package and spend more.
4-Introducing new advertising formats
Introducing New Advertising Styles Try out different ad formats like rewarded videos or playable ads to see if they boost engagement and, consequently, your conversion rate of users who pay.
Experiment with ad placements too. Check if an interstitial ad works better than a banner ad. For apps, assess if native content, blending seamlessly into your app’s content, is less disruptive and more effective at converting.
Consider programmatic advertising to streamline the buying and selling of online ads, creating a smoother process. Targeting tactics ensure the right ad format reaches the right user at the right time, making the experience less disruptive.
What are the uses of ARPPU?
ARPPU holds crucial significance for app businesses, serving as a key metric that outlines the value of each customer in terms of revenue. This understanding allows marketers and advertisers to determine the maximum amount they can invest in acquiring a customer while remaining profitable.
ARPPU is a critical metric for app businesses as it highlights the value of each customer in revenue terms. By having a clear understanding of how much a paying user is worth to the business, allows marketers and advertisers to know exactly how much they can spend to acquire a customer and still be profitable.
Moreover, eCommerce analytics company Putler underscores several reasons why ARPPU is pivotal:
• Indicator of Financial Health: A low ARPPU may suggest that the product isn’t resonating with the audience, while a high ARPPU signals business growth.
• Reflection of Buyer Personas: ARPPU helps in identifying and focusing on high-value buyer personas, steering clear of distractions with lower revenue customers.
• Validation of Sales and Marketing Efforts: ARPPU serves as validation that the sales and marketing teams are effectively targeting the right customers and deals to optimize revenue over time.
ARPPU is a measure of loyalty among all users; those who are more loyal will consistently pay you every month. In essence, a higher ARPPU has the potential to generate more revenue from existing customers.
In summary, ARPPU stands as a vital metric for comprehending a company’s financial well-being and ensures that sales and marketing endeavors are directed toward the right users, optimizing for revenue growth.
ARPPU VS other metrics (ARPU, ARPPU)
In this section, I will highlight the differences among tools for your business, part by part, to facilitate a better understanding and mastery of these measures. These tools play a crucial role in helping your business calculate and report key metrics, including DAU (Daily Active Users), ARPU (Average Revenue Per User), ARPPU (Average Revenue Per Paying User), and ARPDAU (Average Revenue Per Daily Active User) for advertising, campaigns, and more.
Since ARPPU is focused on paying customers, not knowing where these users are coming from can make it difficult to scale marketing efforts. Therefore, these tools help you conduct beneficial analyses, allowing you to focus on paying customers. To address this, tools can collect and attribute revenue data, including in-app purchases, ad revenue, and subscriptions. Therefore, using tools to analyze your ARPPU can make a great contribution in your users.
While ARPU measures the overall effectiveness of a monetization strategy, ARPPU and ARPDAU provide more immediate insights, highlighting specific pricing decisions and users’ reactions. Notably, both the ARPPU formula and ARPDAU formula share similarities, these formulas are designed to analyze and provide insights into the behaviors and contributions of specific subsets of users, rather than looking at the entire user population.
These metrics collectively offer a comprehensive understanding of how different user segments contribute to an app’s revenue dynamics.
ARPPU, concentrating solely on paying customers, offers a unique perspective, but it’s not the sole metric for gauging a user’s average contribution to revenues. Let’s put it side by side with some other well-known measurement metrics.
ARPPU vs. ARPU
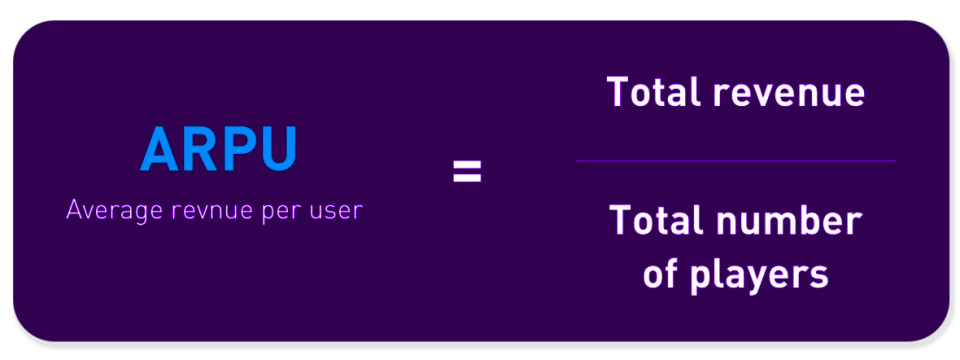
ARPU (average revenue per user) takes into account all users who have installed and used an app, providing a broader view of revenue calculation. On the other hand, ARPDAU (average revenue per daily active user) narrows the focus to individuals who actively engage with the app daily.
As mentioned earlier, the key distinction between ARPPU and ARPU lies in excluding non-paying users and revenue from advertising. Paying and non-paying users engage in different in-app activities, making it crucial to separate them. This separation helps identify both successes and areas that can be improved.
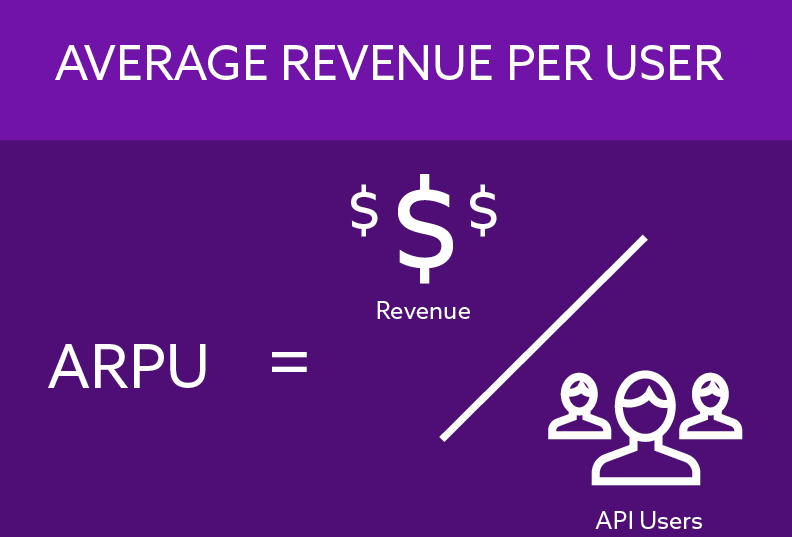
How to Increase ARPU:
To boost ARPU, you can use cross-selling, offering customers-related products for more value. It’s different from upselling because it suggests similar items, not upgrades.
What is the ARPU Ratio?
Calculate ARPU by dividing total revenue in a specific time (like a week or month) by the total active users. For instance, if you made $200 last month with 4000 active users, your Average Revenue Per User is $0.05.
Is ARPU a Leading Indicator?
ARPU is crucial to know a customer’s average value to the company and acts as a leading indicator. A high ARPU signals strong monthly revenue, while a growing ARPU suggests good customer retention.”
What is a Good ARPU?
A higher ARPU (and growing each year) is good for a company in the long term. In these ways, we can improve or deteriorate monetization of the user base
| Increasing ARPU | Decreasing ARPU |
| Sell things for higher prices when you have a big market share. | Lower prices to get more customers, especially when there’s a risk of new businesses. |
| Choose customers carefully, like those who stick around and have money. | Hard to make money from customers who don’t have much. |
| Offer more things to customers. | Not many chances to sell more things to customers. |
| Have a special product or service with a strong brand, so people are willing to pay more | Not a strong brand, needing to give discounts to sell stuff. |
| Not many competitors or worries about others offering lower prices. | Lots of competition and risks of others offering lower prices. |
ARPPU vs. ARPDAU
Average Revenue Per Daily Active User (ARPDAU) is handy for experimenting with various creatives, ad placements, or introducing new ad formats. It allows you to observe reactions and changes in your revenue daily. On the other hand, ARPPU takes a broader view, looking at revenue trends over an extended period—weekly, monthly, quarterly, and so on.

ARPPU vs. LTV
Don’t mix up the ARPU of your mobile games with LTV (lifetime value).
LTV, or lifetime value, considers the value of a user from the time they’re acquired until they stop using the app, be it two weeks or two years. On the other hand, ARPPU looks at a specific time frame, like 30-day ARPPU or 60-day ARPPU.
The tricky part is when a user installs, makes a purchase and stops using the app within the same timeframe as the ARPPU. In such cases, the terms LTV and ARPPU might be used interchangeably, adding a layer of confusion.

LTV is incredibly helpful to figure out if you’re reaching the correct users and to grasp the overall success of your mobile apps. ARPU is great for assessing in-game elements like IAP pricing, acquisition channels, and revenue quality, which we’ll delve into next.
On top of this the money from users who pay for in-app purchases (IAPs) can be quite substantial, the percentage of users who choose to make these purchases is usually very low, sometimes as little as 2%. This low conversion rate highlights the challenge of getting users to become paying customers.
As a response to this challenge, developers are turning to ad monetization as a crucial additional source of income. This strategy involves making money from users who don’t pay by showing them ads.
In this ad-focused context, metrics like Average Revenue Per Daily Active User (ARPDAU) and Average Revenue Per User (ARPU) become valuable.
These metrics consider not only the money generated from paying users but also include revenue from ads, providing a more comprehensive view of the app’s overall financial performance in the context of ad revenue.

How to calculate DAU: Daily Active Users
Counting the number of unique players taking action in your app daily involves careful consideration and analysis. Here’s a breakdown of the process:
- Define Your DAU Criteria:
• The definition of a Daily Active User (DAU) varies between companies and types of apps. Consider what qualifies as an active user for your specific app. For instance, is it someone who downloaded and opened the app, or someone who spent a certain amount of time actively using it? - Use DAU to Identify Real Players:
• DAU is a crucial metric for understanding genuine player engagement. Relying solely on download numbers may yield inaccurate results. Some users might download the game on multiple devices, but actively play on one, while others may download and uninstall immediately. - Be Specific and Honest:
• Clearly define what constitutes an active user, striking a balance between inclusivity and specificity. For example, merely opening the game may not qualify as genuine engagement. Be honest about what truly counts as a player to derive meaningful insights from the figure. - Event Tracking for DAU Calculation:
• Utilize ‘events’ to track various actions in the game, such as ‘Start Game’ or ‘Start Session’. Each event is associated with a user’s ID. DAU is calculated by analyzing the list of unique players who completed these events daily. - Monitor Changes in DAU vs. Downloads:
• Regularly assess the relationship between DAU and download numbers. A significant drop in DAU compared to downloads may indicate issues with user retention. Investigate potential reasons for this decline and consider making changes to improve user satisfaction.
In case your DAU is much lower than downloads, it could be due to various reasons, such as misleading advertisements, ineffective tutorial levels, excessive ads, or lack of replay value. Running experiments, possibly through A/B testing, can help identify and address these issues to enhance user retention and overall enjoyment of the app.
Conclusion
In simple terms, Average Revenue Per Paying User (ARPPU) is a special tool in the mobile game world. It helps companies see how much money they make, on average, from players who spend money in the game. It’s like a money gauge for loyal users, showing the value of paying customers. ARPPU is super important in areas like gaming, where only a small percentage pays. It helps companies focus on channels and campaigns that bring in the most valuable customers, ensuring smart decisions for making money. ARPPU is a key measure for app businesses, providing insights into customer value and optimizing revenue growth.
